Showing posts with label Human Development Index. Show all posts

Papua New Guinea's GDP per capita: Trends, composition, challenges, and prospects

Papua New Guinea is a lower-middle-income country with a GDP per capita of *$2,708 in 2022. While this is lower than the global average, Papua New Guinea's GDP per capita has been growing steadily in recent years. The mining sector is the largest contributor to the economy, followed by agriculture, forestry, and fishing. However, the country faces a number of challenges to further development, including a large informal sector, high levels of poverty and inequality, limited access to basic services, poor infrastructure, and a challenging business environment. Despite these challenges, Papua New Guinea has the potential to achieve strong economic growth in the coming years. Policymakers can focus on promoting economic diversification, investing in infrastructure and social services, improving the business environment, and reducing poverty and inequality to boost GDP per capita and create a brighter future for all Papua New Guineans.


*The World Bank classifies countries as lower-middle-income if their GDP per capita is between $1,046 and $4,095. Papua New Guinea's GDP per capita of $2,708 is therefore in the lower end of the range for lower-middle-income countries.

Papua New Guinea's GDP per capita
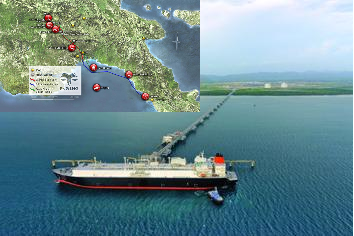
The PNG LNG project has had a significant impact on Papua New Guinea's GDP per capita, boosting it by an average of 1.5% per year since 2014. It has also created jobs and reduced poverty, although this impact was largely evident during the development phase. Since then, the project has not generated as many new jobs or opportunities, but it has continued to generate tax revenue for the government.


Introduction

Gross domestic product (GDP) per capita is a measure of economic well-being. It is calculated by dividing the total value of all goods and services produced in a country (GDP) by the population. GDP per capita is often used to compare the living standards of different countries.

Papua New Guinea is a lower-middle-income country with a GDP per capita of $2,708 in 2022 (World Bank). This is lower than the global average of $12,241. However, Papua New Guinea's GDP per capita has grown by an average of 2.5% per year over the past decade.


Trends

The growth of Papua New Guinea's GDP per capita has been driven by a number of factors, including strong growth in the mining and construction sectors, as well as an increase in government spending on infrastructure and social services. The mining sector is the largest contributor to the economy, accounting for around 20% of total output. The other main sectors of the economy are agriculture, forestry, and fishing (16%), construction (12%), and wholesale and retail trade (11%).

Papua New Guinea's GDP per capita comparison


Composition

Papua New Guinea's economy is heavily dependent on the mining and oil and gas sectors. This makes the economy vulnerable to fluctuations in commodity prices. The government is working to diversify the economy and reduce its reliance on mining. However, this process will take time.

In addition to mining, Papua New Guinea has a significant agricultural sector. Agriculture employs around 80% of the population and contributes around 16% to GDP. However, agricultural productivity is low and many farmers live in poverty. The government is working to improve agricultural productivity and support farmers through programs such as the Special Agriculture and Business Lease (SABL) program.
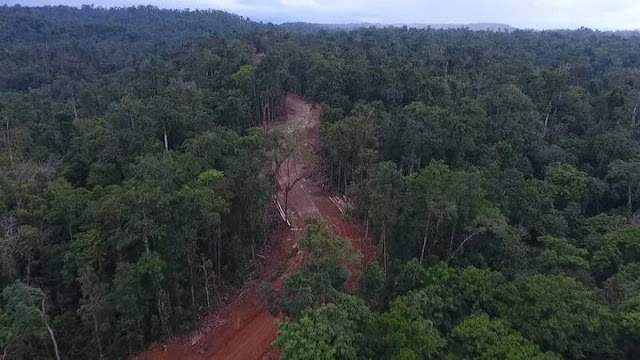
The government is working to improve agricultural productivity and support farmers through programs such as the Special Agriculture and Business Lease (SABL) program.
Logging Special Agriculture and Business Lease (SABL) areas


Challenges

Despite recent economic growth, Papua New Guinea faces a number of challenges to further development. These challenges include:


  • A large informal sector, which is estimated to account for over 80% of the economy.
  • Limited access to basic services such as education and healthcare.
  • High level of systemic and sytematic corruption.
  • A challenging business environment.
  • High levels of poverty and inequality.
  • Poor infrastructure.

The informal sector is a major challenge for the Papua New Guinean economy. It is difficult to tax and regulate the informal sector, which limits the government's ability to raise revenue and provide services. The informal sector also deprives workers of important benefits such as social security and minimum wages.

High level of systemic and sytematic corruption


Poverty and inequality

Poverty and inequality are also major challenges for Papua New Guinea. According to the World Bank, around 40% of the population lives below the national poverty line. Inequality is also high, with the richest 10% of the population earning more than 40% of the country's income.

Papua New Guinea also faces a number of challenges in terms of access to basic services. The country has a high illiteracy rate and many people lack access to healthcare. Infrastructure is also poor, with many roads and bridges in need of repair.

Finally, the business environment in Papua New Guinea is challenging. The country has a complex regulatory environment and corruption is a problem. This makes it difficult for businesses to operate and invest in the country.


Prospects

Despite the challenges listed above, Papua New Guinea has the potential to achieve strong economic growth in the coming years. The country has a wealth of natural resources, a young and growing population, and a government that is committed to economic reform. If the government can successfully address the challenges listed above, Papua New Guinea can achieve significant progress in terms of economic growth and poverty reduction.


Conclusion

Papua New Guinea has made significant progress in recent years in terms of economic growth and poverty reduction. However, the country still faces a number of challenges, including a large informal sector, high levels of poverty and inequality, limited access to basic services, poor infrastructure, and a challenging business environment.

Policymakers can focus on promoting economic diversification, investing in infrastructure and social services, improving the business environment, and reducing poverty and inequality to boost GDP per capita and create a brighter future for all Papua New Guineans.


Recommendations

Here are some specific recommendations for policymakers in Papua New Guinea:

  • Promote economic diversification by investing in sectors such as agriculture, tourism, and manufacturing.
  • Invest in infrastructure and social services such as education, healthcare, and transportation.
  • Improve the business environment by reducing regulatory burdens and combating corruption.
  • Reduce poverty and inequality through targeted social programs and investments in human capital.

If the government can successfully address these challenges, Papua New Guinea can achieve significant progress towards its goal of becoming a high-income country.


Additional resources

Donor and reseaches

  • World Bank: Papua New Guinea Country Overview
  • International Monetary Fund: Papua New Guinea Country Report
  • Asian Development Bank: Papua New Guinea Country Profile
  • Papua New Guinea Government: Website
  • Papua New Guinea Institute of National Affairs: Website


Academic journals and books

  •  Asian Development Bank. (2022). Papua New Guinea Economic Update 2022.
  • World Bank. (2022). Papua New Guinea Country Economic Memorandum: Building a More Resilient and Inclusive Economy.
  • Lowy Institute. (2022). Papua New Guinea: Economic Challenges and Opportunities.
  • Papua New Guinea Institute of National Affairs. (2022). Papua New Guinea Economic Outlook 2023

Illegal Logging in Papua New Guinea Alarming COP27

The video is an edited version of the online streaming conference on Climate Change and the effects of  Illegal Logging in Papua New Guinea, during the COP26 summit. What has come of it now Papua New Guinea delegates are going to the COP27?

Illegal Logging in PNG Concerning

The COP26 was held in Glasgow where 62 PNG delegates participated. 

This video features Hon. Governor of Oro Province Garry Juffa talking about vile operations of the Melanesian logger in Papua New Guinea. 

His province is a hotspot for illegal logging. 

Listen to his fight against the organised syndicate that is damaging forests in Papua New Guinea.

It is widely known that most of the logging operations in PNG have elements of manipulation, cohesion and corruption. Not one of them is clean.

Read our articles on deforestation caused by the illegal loggers in PNG

Gary Juffa talks about illegal logging operations in Papua New Guinea.

00:00 - Malaysian Loggers - WHO ARE THEY?

02:00 - Start of Distruction on Forest in Papua New Guinea

07:23 - Inquiry into Illegal Logging in PNG - WHAT HAPPENED WILL SHOCK YOU!

10:05 - What Happened to Illegal Logging in Oro Province

17:00 - Illegal Loggers causing Waterway Pollutions

20:30 - The same loggers are destroying forests in the Solomon Islands

22:33 - What the International Community should do!

26:20 - Gordon Brown commentary on Illegal logging and destruction of the environment in Sarawak and Papua New Guinea.

29:00 - Appeal to International Community

Immigration and Development: Is Papua New Guinea a Temporary Settlement?

This is a script from the History of Papua New Guinea Immigration and Development - an article based on recollection and experience of the writer. 


Temporary settlers

The immigrating population in PNG may refer to foreign nationals looking to Australia and New Zealand as their destinations. The bureaucracy may not have allowed them to get into the intended countries. Many possibly have families and friends living there which makes it more attractive destinations from the outside.

They remained in PNG taking up job making PNG a temporary transit home. In hindsight, time is of the essence before they would steal the opportunity to make it to their Promised Land.


Refugees on Manus Island

The Manus Island Immigrants Detention Centre created by the Australian Government is an immigration burden to PNG. In fact, PNG would be happy for Australia to whatever it wants with them. 

The detention adds to social development issues on the island. The immigrant children born to local women faced an uncertain future.

The big question going forward is what is going to happen to the immigrants on Manus Island? What about the children they are having with the local women on Manus?

Will Australia take responsibility of the children who are born to the immigrants on Manus as Australian citizens? They cannot be left stateless. 

The social implications on the lives of the refugees and their children are the results of the policy decision by the Australian government.

The boats were diverted to Manus. The question is when is it going to arrive at their destination.

Refocusing immigration on development 

The recent immigration pattern is completely distorted. The temporary migrants and Manus Refugees do not have any bearing on the development of the country. Not long term benefits at all!

PNG history showed us that immigration and development worked well in the past when the intention is for developing the country.

Perhaps it is important PNG recognises immigration as a driver for development. Immigration patterns have been left unchecked for a long time. As a developing country, immigration must be for development. 


The complete article attempts to show the positive impacts of immigration on development in the past. And compares it to present immigration patterns. 

What does it mean to be ranked 154/188 on the Human Development Index - PNG, Vanuatu, Fiji & Australia

UNDP, 2016


Australia

A Very Human High Development country with Human Development Index (HDI) value of 0.939 out of high of 1.0, Life Expectancy at Birth of 82.5 years, Expected Years of Schooling of 20.4 years, Mean School Years of 13.2 years, Gross National Income (GNI) per capita of $42,822 (International Currency) and GNI per capita minus HDI rank of 19. Of the 188 HDI ranking, Australia was ranked 3rd in 2014 and moved one place up to 2nd in 2015.

Fiji

A High Human Development country. It has a HDI value of 0.736 out of a possible 1.0, Life Expectancy at Birth of 70.2 years, Expected Years of Schooling of 15.3 years, Expected Years of Schooling of 10.5 years, GNI per capita of $8,245 (International Currency) and GNI per capita minus HDI rank of 20. Fiji was ranked 91 in 2014 and remained at 91 in 2015 among the 188 countries.

Vanuatu 

Vanuatu is categorised as a Medium Human Development country. Vanuatu has HDI value of 0.597 out of a high of 1.0, Life Expectancy at Birth of 72.1 years, Expected Years of Schooling 10.8 years, Mean School Years of 6.8 years, GNI per capita of $2,805 (International Dollar) and GNI per capita minus HDI rank value of 23. Vanuatu ranked 134 in 2014 and remained unchanged at 134 out of the 188 countries on the HDI ranking.

Papua New Guinea

PNG was categorised as Low Human Development Country. PNG has HDI value of 0.516 out of a high of 1.0, Life Expectancy at Birth of 62.8 years, Expected Years of Schooling at 9.9 years, Mean Years of Schooling at 4.3 years, GNI per capita of $2,712 (International Currency) and GNI per capita minus HDI rank value of 4. PNG HDI rank was 153 in 2014 but fell 1 place to 154 in 2015 out of the 188 countries ranked.

Comparison - some similarities 

  1. Australia (VHHD), Fiji (HHD) and Vanuatu (MHD) have HDI value was near 0.6 or higher,
  2. Life Expectancy at Birth above 70 years where Fiji and Vanuatu’s Life Expectancy at Birth were 70.2 years and 72.1 years respectively. 
  3. Expected Years of Schooling for the three countries have an interval of 5 years with Australia at 20.4 years, Fiji at 15.3 years and Vanuatu at 10.8 years, 
  4. GNI per capita about $3,000 (Vanuatu = $2,802) or more 
  5. GNI per capita minus HDI rank value more approximately equal to 20. 
  6. Fiji and Vanuatu DHI ranks have remained the same in 2014 and 2015 at 91 and 134, respectively. Australia’s HDI rank improve from 3rd in 2014 to 2nd in 2015.


 Contrast - some differences 

  1. The difference between the Human Development Index (HDI) value of Australia and Fiji was 0.203 (0.939 – 0.736 = 0.203) and Australia and PNG was 0.423 (0.939 – 0.516 = 0.423) indicating a wide disparity between the VHHD – MDH and VHHD – LDH countries; 
  2. The difference between the Life Expectancy at Birth of Australia and Fiji was 12.3 years (82.5 – 70.2 = 12.3 years) and Australia and PNG was 19.7 years (82.5 – 62.8 = 19.7 years another example of identifying disparity between the VHHD – MDH and VHHD – LDH countries;
  3.  The difference between the Expected Years of Schooling in Australia and Fiji was 5.1 years (20.4 – 15.3 = 5.1 years) and Australia and PNG was 10.5 years (20.4 – 9.9 = 10.5 years)
  4. The difference between the Mean School Year in Australia and Fiji was 2.7 years (13.2 – 10.5 = 2. 7 years) and Australia and PNG was 8.9 years (13.2 – 4.3 = 6.2 years);
  5. The difference between the Gross National Income per capita in Australia and Fiji was $34,577 ($42,822 - $8,245 = $34,577) and Australia and PNG was $42 110 ($42,822 – 2,712 = $42,110) ; and 
  6. The difference between the GNI per capita minus HDI rank in Australia and Fiji was -1 (19 – 20 = -1, Fiji higher value than Australia) and Australia and PNG was 15 (19 – 4 = 15). 

Summary 

The indicators for the VHHD, HHD and MHD countries showed relatively close similarities when the indicators of an MHD country was used, in this case Vanuatu. There were significant differences when the human development indicators from PNG (a LHD country) were differentiated again the indicators from VHHD and HHD countries. 

The HDI ranks for 2014 and 2015 showed that Australia improved by one place from 3rd to 2nd, Fiji retained its rank at 91, Vanuatu retained its rank at 134 and PNG’s rank dropped from 153 to 154.

POST A COMMENT.

SEARCH THE ENTIRE SITE HERE

Download University of Goroka Application Forms PDF

Download University of Goroka Application Forms PDF
CLICK ON THE IMAGE TO DOWNLOAD THE 2025 APPLICATION FORM