Agriculture in PNG: Unearthing the Past Agricultural Practices and Its Future Prospects

Agriculture in Papua New Guinea (PNG) has a long and fascinating history that dates back thousands of years. Archaeological excavations and research at Kuk, in the highlands of PNG, have provided valuable insights into the practices of the past, shedding light on the early cultivation techniques and land usage. 

This article explores the evidence of ancient agricultural practices at Kuk and what it means for the future of agriculture in PNG. It is based on ''The Case for 10,000-Year-Old Agriculture'' [PDF] in the Whagi Valley by Tim Denham, Jack Golson and Philip Hughes.

(Note that these practices are widely practised in present-day Whagi Valley and other parts of the Highlands of Papua New Guinea)

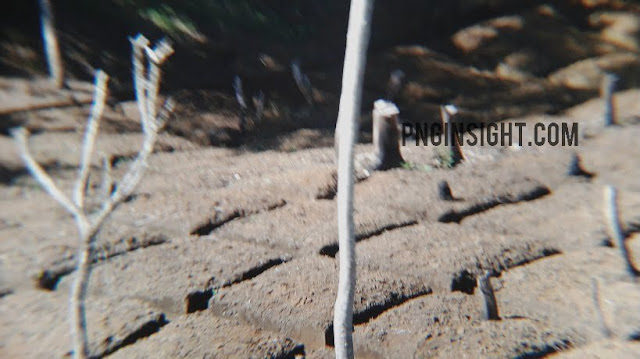
Kuk ditch and traditional agriculture practices in PNG


Unearthing the Past: Agriculture at Kuk 10,000 Years Ago

In 1974, while studying plantation drains at Kuk, archaeologists discovered evidence of human activities buried beneath grey clay. 

Excavations in subsequent years revealed a palaeochannel and a palaeosurface, unique features dating back 10,000 years. The palaeochannel, known as Kundil's Baret, was likely used for irrigation, while the palaeosurface, found adjacent to the channel, displayed signs of former agricultural plots.

The evidence suggests that people were manipulating the environment around Kuk 10,000 years ago. They engaged in forest clearance and dryland cultivation using a swiddening regime, which involved slash-and-burn techniques. These practices led to increased erosion and significant changes in the local landscape.

The palaeosurface features, such as pits, runnels, stakeholes, and postholes, indicate that people cultivated various edible plants, including taro, bananas, gingers, yams, and other vegetables and fruits. The presence of a stone pestle used to process starch-rich food plants further confirms their reliance on agriculture for sustenance.


The Debate: Wetland Agriculture or Modified Dryland Practices?

Archaeologists and researchers have debated the interpretation of the evidence at Kuk. Some believe that the palaeosurface features indicate the emergence of wetland agriculture, specifically focused on cultivating taro. Others argue that the practices observed were similar to extensive forms of plant exploitation or potentially swidden cultivation, with no significant distinction between dryland and wetland agriculture.

While the specific interpretation remains a subject of debate, all agree that the multidisciplinary evidence points to prehistoric plant exploitation and cultivation practices. The study of plant remains, the palaeoecological signals, and the archaeological remains at Kuk offer valuable insights into the early agricultural activities in PNG.


Sustainable Agriculture and Food Security

Understanding the practices of the past can inform the future of agriculture in PNG. The ancient cultivation techniques at Kuk, focused on diverse crops for sustenance, resonate with modern concepts of sustainable agriculture and food security. 

The historical reliance on a wide variety of crops highlights the importance of crop diversity in mitigating risks associated with climate change and other challenges.

Learning from the past, modern agricultural practices in PNG can be diversified, promoting the cultivation of various traditional crops alongside modern varieties. 

agriculture in papua new guinea

Implications for the Future of Agriculture in PNG

Adopting sustainable farming methods, such as agroforestry and crop rotation, can enhance soil fertility and prevent erosion, contributing to long-term agricultural productivity.

By combining the knowledge of past practices with contemporary agricultural innovations, PNG can build a resilient and sustainable agriculture sector, ensuring food security and prosperity for future generations.

Drawing lessons from the past, PNG has the opportunity to develop a robust and sustainable agricultural sector.


Agriculture in PNG

Agriculture in Papua New Guinea has a rich history that spans thousands of years. The discoveries at Kuk provide a glimpse into the past practices of land usage and cultivation techniques. 

The evidence suggests that early farmers engaged in diverse agricultural activities, focusing on a variety of crops to sustain their communities.

By promoting crop diversity and adopting eco-friendly practices, the future of agriculture in PNG can be cultivated to ensure the prosperity and well-being of its people for generations to come.

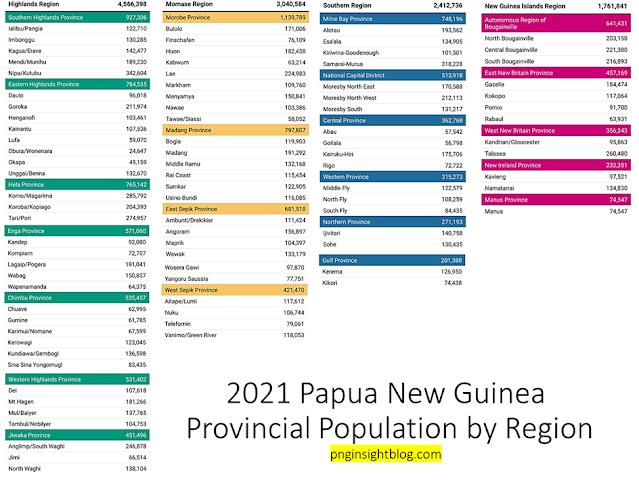
Papua New Guinea Population Estimate 2021

The provided text contains information about the Population Estimates 2021 for Papua New Guinea (PNG) produced by the National Statistical Office (NSO).  It's important to note that the Population Estimates 2021 for PNG were generated through the use of satellite images and surveys. 

The data is crucial for decision-making and planning at various levels of government and institutions, contributing to the country's development goals. The estimate's accuracy is acknowledged, but it is also recognised that a complete census remains the most reliable data source.


PNG's Total Population in 2021: 11,781,559

   - Males: 6,142,585

   - Females: 5,638,974

This estimate is higher than the predicted population figures from the CIA World Factbook (2022, Wikipedia.org) we used here.

Papua New Guinea Population 2021


Population Key Indicators (2021 Estimates)

Each of the figures in the Population Key Indicators provides valuable information about the age and gender distribution of the population in Papua New Guinea in 2021. 

Let's explain each of these indicators:

1. Sex Ratio (Male to Female): 108.9

This figure represents the number of males for every 100 females in the population. In this case, the sex ratio is 108.9, indicating that there are approximately 108.9 males for every 100 females in the country. 

A sex ratio greater than 100 indicates that there are more males than females in the population.


2. Percentage of Working Age Population (15 to 64 years old): 61.6%

This percentage represents the proportion of the population that falls within the working-age group, which is typically considered to be between 15 and 64 years old. 

In this case, 61.6% of the population is within this age range and is likely to be part of the labour force and actively contributing to the economy.


3. Percentage of Older Population (65 years old and over): 2.7%

This percentage represents the proportion of the population that is 65 years old and older. It indicates the share of elderly individuals in the total population. 

A higher percentage suggests that the population is ageing, which can have implications for healthcare, social services, and pension systems.


4. Percentage of Youth (15 to 24 years old): 21.6%

This percentage represents the proportion of the population that falls within the youth age group, typically considered to be between 15 and 24 years old. 

This demographic segment includes young adults who are transitioning from adolescence to adulthood and may be pursuing education or entering the workforce.


5. Total Dependency Ratio (0-14 + 65 years old) / 15-64 years old: 62.4%

The total dependency ratio is a measure of the economic burden on the working-age population. It is calculated by dividing the combined number of individuals aged 0 to 14 (children) and 65 years and over (elderly) by the number of individuals aged 15 to 64 (working age). 

In this case, for every 100 working-age individuals, there are 62.4 dependents who are either too young or too old to participate in the labour force.


6. Children Dependency Ratio (0-14 / 15-64 years old): 58.1%

The children dependency ratio specifically measures the burden on the working-age population due to children (aged 0 to 14). It is calculated by dividing the number of children by the number of working-age individuals. 

A higher ratio indicates a larger proportion of children dependent on the working-age population.


7. Old-Age Dependency Ratio (65 years old and over / 15-64 years old): 4.3%

The old-age dependency ratio measures the burden on the working-age population due to elderly individuals (aged 65 and over). It is calculated by dividing the number of elderly individuals by the number of working-age individuals. 

A higher ratio indicates a larger proportion of elderly dependents on the working-age population.


8. Median Age (Both Sexes): 21.2

Median age represents the midpoint of the age distribution, where half of the population is older than the median age, and half is younger. 

In this case, the median age for both sexes is 21.2 years, suggesting a relatively young population.


9. Median Age (Male): 20.8

The median age specifically for males, which is 20.8 years. This indicates that the midpoint of the male age distribution is 20.8 years.


10. Median Age (Female): 21.7

The median age specifically for females, which is 21.7 years. This indicates that the midpoint of the female age distribution is 21.7 years.


11. Percentage of Population Aged 18 and Over: 57.2%

This percentage represents the proportion of the population that is 18 years old and older. It indicates the share of adults in the total population who are eligible to participate in various legal and social activities.


12. Percentage of Women of Reproductive Age (15 to 49 years old): 55.3%

This percentage represents the proportion of women in the population who are within the reproductive age range of 15 to 49 years old. 

This demographic segment is significant as it relates to issues concerning family planning, maternal health, and childbirth.

The population key indicators are essential for understanding the demographic composition of Papua New Guinea's population and can assist policymakers and planners in making informed decisions about various aspects of development, including healthcare, education, and social services.


How the Estimate is Calculated

The estimate is based on a series of different datasets and methods. The NSO uses recent, reliable population data collection exercises such as the Urban Structural Listing and Household Survey for the Long Lasting Insecticidal Net Distribution by Rotarians Against Malaria. 

Geographic and administrative characteristics, such as night-time lights, distance to health providers, and slope, are measured using aerial images collected from satellites. 

The relationship between population size and these characteristics is used to estimate the population in areas with limited data.


Accuracy of the Estimate

The Population Estimate has a 3% margin of error at the national level. However, it is emphasised that the estimate does not replace a National Population and Housing Census, which remains the most reliable source of information, providing not only population counts but also socio-demographic and economic characteristics at the lowest level of geographic subdivision of the country.

POST A COMMENT.

SEARCH THE ENTIRE SITE HERE

Public Holidays in PNG 2025

Public Holidays in PNG 2025
CLICK ON THE IMAGE TO GET THE LATEST INFORMATION